
 A Oneindia Venture


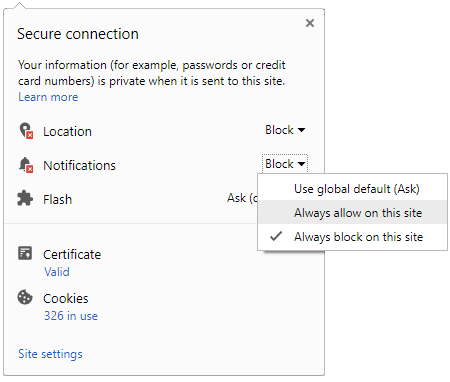
 Click it and Unblock the Notifications
UTI Nifty 500 Value 50 Index Fund
3 Year Absolute Returns
62.74% ↑
NAV (₹) on 16 Nov 2026
21.38
1 Day NAV Change
-0.44%
Risk Level
Very High Risk
Rating
-
UTI Nifty 500 Value 50 Index Fund is a Equity mutual fund categorized under Index, offered by UTI Asset Management Co. Ltd.. Launched on 26 Apr 2023, investors can start with a minimum SIP of ₹100 or ... Read more
NAV History
Fund Details
Returns Calculator
Asset Allocation
AUM
₹ 827.90 Cr
Sector Holdings
| Sectors | Weightage |
|---|---|
| Finance - Banks - Public Sector | 14.95% |
| Mining/Minerals | 11.36% |
| Refineries | 10.30% |
| Power - Generation/Distribution | 6.78% |
| Aluminium | 6.64% |
| Oil Drilling And Exploration | 6.24% |
| Cement | 5.34% |
| Power - Transmission/Equipment | 5.10% |
| Finance - Banks - Private Sector | 4.89% |
| Finance - Term Lending Institutions | 4.36% |
| Auto - LCVs/HCVs | 4.25% |
| Trading & Distributors | 2.71% |
| Hospitals & Medical Services | 2.40% |
| Gas Transmission/Marketing | 2.34% |
| Agro Chemicals/Pesticides | 1.79% |
| Iron & Steel | 1.59% |
| Shipping | 1.42% |
| LPG/CNG/PNG/LNG Bottling/Distribution | 1.33% |
| Construction, Contracting & Engineering | 1.29% |
| IT Consulting & Software | 0.81% |
| Finance - Housing | 0.74% |
| Edible Oils & Solvent Extraction | 0.73% |
| Chemicals - Inorganic - Caustic Soda/Soda Ash | 0.70% |
| Entertainment & Media | 0.65% |
| Finance & Investments | 0.53% |
| Fertilisers | 0.40% |
| Lubricants | 0.33% |
| Current Assets | 0.03% |
Stock Holdings
| Name | Weightage | Value (in Cr.) | Sector |
|---|---|---|---|
| GRASIM INDUSTRIES LTD. | 5.34% | ₹ 44.18 | Cement |
| OIL & NATURAL GAS CORPORATION | 5.26% | ₹ 43.53 | Oil Drilling And Exploration |
| STATE BANK OF INDIA | 5.20% | ₹ 43.09 | Finance - Banks - Public Sector |
| POWER GRID CORPORATION OF INDI | 5.10% | ₹ 42.22 | Power - Transmission/Equipment |
| HINDALCO INDUSTRIES LTD. | 5.07% | ₹ 41.99 | Aluminium |
| NTPC LTD. | 4.96% | ₹ 41.05 | Power - Generation/Distribution |
| COAL INDIA LTD. | 4.93% | ₹ 40.82 | Mining/Minerals |
| VEDANTA LTD | 4.71% | ₹ 39.03 | Mining/Minerals |
| TATA MOTORS PASSENGER VEHICLES LTD. | 4.25% | ₹ 35.18 | Auto - LCVs/HCVs |
| BHARAT PETROLEUM CORPN LTD. | 4.16% | ₹ 34.45 | Refineries |
| INDIAN OIL CORPORATION LTD. | 3.64% | ₹ 30.11 | Refineries |
| REDINGTON LTD | 2.71% | ₹ 22.42 | Trading & Distributors |
| HINDUSTAN PETROLEUM CORPN. LTD | 2.50% | ₹ 20.69 | Refineries |
| POWER FINANCE CORPORATION LTD. | 2.48% | ₹ 20.55 | Finance - Term Lending Institutions |
| ASTER DM QUALITY CARE LIMITED | 2.40% | ₹ 19.91 | Hospitals & Medical Services |
| GAIL ( INDIA )LTD. | 2.34% | ₹ 19.35 | Gas Transmission/Marketing |
| BANK OF BARODA | 2.09% | ₹ 17.26 | Finance - Banks - Public Sector |
| PUNJAB NATIONAL BANK | 1.98% | ₹ 16.39 | Finance - Banks - Public Sector |
| REC LTD | 1.88% | ₹ 15.59 | Finance - Term Lending Institutions |
| CANARA BANK | 1.81% | ₹ 15 | Finance - Banks - Public Sector |
| UPL LTD. | 1.79% | ₹ 14.86 | Agro Chemicals/Pesticides |
| NMDC LTD. | 1.72% | ₹ 14.23 | Mining/Minerals |
| FEDERAL BANK LTD. | 1.71% | ₹ 14.18 | Finance - Banks - Private Sector |
| INDUSIND BANK | 1.68% | ₹ 13.92 | Finance - Banks - Private Sector |
| STEEL AUTHORITY OF INDIA LTD. | 1.59% | ₹ 13.16 | Iron & Steel |
| NATIONAL ALUMINIUM CO. LTD. | 1.57% | ₹ 13.02 | Aluminium |
| UNION BANK OF INDIA | 1.54% | ₹ 12.78 | Finance - Banks - Public Sector |
| GREAT EASTERN SHIPPING CO. LTD | 1.42% | ₹ 11.74 | Shipping |
| INDIAN BANK | 1.02% | ₹ 8.49 | Finance - Banks - Public Sector |
| OIL INDIA LTD. | 0.98% | ₹ 8.15 | Oil Drilling And Exploration |
| PETRONET LNG LTD. | 0.98% | ₹ 8.13 | LPG/CNG/PNG/LNG Bottling/Distribution |
| KARUR VYSYA BANK LTD. | 0.88% | ₹ 7.30 | Finance - Banks - Private Sector |
| BANK OF INDIA | 0.87% | ₹ 7.16 | Finance - Banks - Public Sector |
| CYIENT LTD | 0.81% | ₹ 6.71 | IT Consulting & Software |
| IRB INFRASTRUCTURE DEV LTD. | 0.76% | ₹ 6.26 | Construction, Contracting & Engineering |
| LIC HOUSING FINANCE LTD. | 0.74% | ₹ 6.16 | Finance - Housing |
| AWL AGRI BUSINESS LIMITED | 0.73% | ₹ 6.05 | Edible Oils & Solvent Extraction |
| RELIANCE POWER LTD. | 0.72% | ₹ 6 | Power - Generation/Distribution |
| TATA CHEMICALS LTD. | 0.70% | ₹ 5.81 | Chemicals - Inorganic - Caustic Soda/Soda Ash |
| ZEE ENTERTAINMENT ENTERPRISES | 0.65% | ₹ 5.35 | Entertainment & Media |
| CESC LTD. | 0.60% | ₹ 4.94 | Power - Generation/Distribution |
| CHOLAMANDALAM FINANCIAL HOLDIN | 0.53% | ₹ 4.37 | Finance & Investments |
| NCC LTD | 0.53% | ₹ 4.39 | Construction, Contracting & Engineering |
| JAIPRAKASH POWER VENTURES LT | 0.50% | ₹ 4.18 | Power - Generation/Distribution |
| BANK OF MAHARASHTRA | 0.44% | ₹ 3.61 | Finance - Banks - Public Sector |
| BANDHAN BANK LTD. | 0.41% | ₹ 3.36 | Finance - Banks - Private Sector |
| CHAMBAL FERTILISERS & CHEMICAL | 0.40% | ₹ 3.32 | Fertilisers |
| INDRAPRASTHA GAS LTD. | 0.35% | ₹ 2.89 | LPG/CNG/PNG/LNG Bottling/Distribution |
| CASTROL INDIA LTD. | 0.33% | ₹ 2.72 | Lubricants |
| RBL BANK LTD | 0.21% | ₹ 1.75 | Finance - Banks - Private Sector |
| NET CURRENT ASSETS | 0.03% | ₹ 0.12 | Others |
Returns
| Annualised returns | ||||
|---|---|---|---|---|
| 9M | 1Y | 2Y | 3Y | |
| Fund returns | -4.83% | 2.68% | 7.42% | 17.62% |
| Category returns | 1.20% | 0.81% | 7.13% | 17.31% |
Fund Objective
The Investment objective of the Scheme is to provide returns that, before expenses, corresponds to the total return of the securities as represented by the underlying index, subject to tracking error. ... Read more
AMC Details
Top Funds from Others - Index Funds/ETFs
|
Scheme Name
|
NAV
|
Returns
1Y
3Y
5Y
|
AUM (Cr)
|
Expense Ratio
|
Risk Meter
|
||
|---|---|---|---|---|---|---|---|
|
UTI Silver Exchange Traded Fund
ETF
Regular
|
₹163.35 | 6.49% | 129.57% | 0.00% | ₹1,286 | 0.59% |
Very High
|
|
Mirae Asset NYSE FANG + ETF
ETF
Regular
|
₹154.97 | 8.64% | 129.21% | 161.53% | ₹4,059 | 0.66% |
Very High
|
|
Aditya Birla Sun Life Silver ETF
ETF
Regular
|
₹168.85 | 5.82% | 126.73% | 0.00% | ₹2,385 | 0.35% |
Very High
|
|
Kotak Silver ETF
ETF
Regular
|
₹16.41 | 5.76% | 126.38% | 0.00% | ₹3,120 | 0.35% |
Very High
|
|
ICICI Prudential Silver ETF
ETF
Regular
|
₹168.60 | 5.69% | 125.63% | 0.00% | ₹11,932 | 0.40% |
Very High
|
|
Mirae Asset Silver ETF
ETF
Regular
|
₹165.01 | 5.84% | 125.43% | 0.00% | ₹1,016 | 0.35% |
Very High
|
|
DSP Silver ETF
ETF
Regular
|
₹16.24 | 5.31% | 125.17% | 0.00% | ₹1,140 | N/A |
Very High
|
|
Nippon India Silver ETF
ETF
Regular
|
₹161.70 | 5.56% | 124.07% | 0.00% | ₹26,991 | N/A |
Very High
|
|
HDFC Silver ETF
ETF
Regular
|
₹161.78 | 5.37% | 123.83% | 0.00% | ₹6,755 | 0.50% |
Very High
|
|
Axis Silver ETF
ETF
Regular
|
₹168.51 | 5.91% | 123.39% | 0.00% | ₹1,742 | 0.42% |
Very High
|
Top Funds from UTI Asset Management Co. Ltd.
|
Scheme Name
|
NAV
|
Returns
1Y
3Y
5Y
|
AUM (Cr)
|
Expense Ratio
|
Risk Meter
|
||
|---|---|---|---|---|---|---|---|
|
UTI Silver Exchange Traded Fund
ETF
Regular
|
₹163.35 | 6.49% | 129.57% | 0.00% | ₹1,286 | 0.59% |
Very High
|
|
UTI Silver ETF Fund of Fund - Direct Plan
Fund of Funds
Direct
|
₹21.53 | 4.97% | 124.07% | 0.00% | ₹531 | 0.14% |
Very High
|
|
UTI Silver ETF Fund of Fund
Fund of Funds
Regular
|
₹21.26 | 4.62% | 121.71% | 0.00% | ₹531 | 0.46% |
Very High
|
|
UTI Gold Exchange Traded Fund
ETF
Regular
|
₹112.39 | 6.71% | 117.59% | 160.81% | ₹4,250 | 0.59% |
High
|
|
UTI Gold ETF Fund of Fund - Direct Plan
Fund of Funds
Direct
|
₹25.60 | 6.21% | 116.60% | 0.00% | ₹1,477 | 0.07% |
High
|
|
UTI Gold ETF Fund of Fund
Fund of Funds
Regular
|
₹25.16 | 5.80% | 113.97% | 0.00% | ₹1,477 | 0.46% |
High
|
|
UTI Healthcare Fund - Direct Plan
Sector
Direct
|
₹399.35 | 21.82% | 88.77% | 122.57% | ₹1,433 | 1.34% |
Very High
|
|
UTI Healthcare Fund - Direct Plan
Sector
Direct
|
₹308.67 | 21.82% | 88.77% | 122.57% | ₹1,433 | 1.34% |
Very High
|
|
UTI Healthcare Fund - Direct Plan
Sector
Direct
|
₹308.67 | 21.82% | 88.77% | 122.57% | ₹1,433 | 1.34% |
Very High
|
|
UTI Healthcare Fund
Sector
Regular
|
₹270.29 | 20.67% | 83.34% | 111.54% | ₹1,433 | 2.22% |
Very High
|
FAQs
What is the current NAV of UTI Nifty 500 Value 50 Index Fund Regular Growth?
What is the fund size (AUM) of UTI Nifty 500 Value 50 Index Fund Regular Growth?
What are the historical returns of UTI Nifty 500 Value 50 Index Fund Regular Growth?
What is the risk level of UTI Nifty 500 Value 50 Index Fund Regular Growth?
What is the minimum investment amount for UTI Nifty 500 Value 50 Index Fund Regular Growth?
Disclaimer: This is 3rd Party content/feed, viewers are requested to use their discretion and conduct proper diligence before investing, GoodReturns does not take any liability on the genuineness and correctness of the information in this article
-
Block for 8 hours
-
Block for 12 hours
-
Block for 24 hours
-
Don't block

 Sign in with Google
- Male
- Female
- Others
- Under 18
- 18 to 25
- 26 to 35
- 36 to 45
- 45 to 55
- 55+