
 A Oneindia Venture


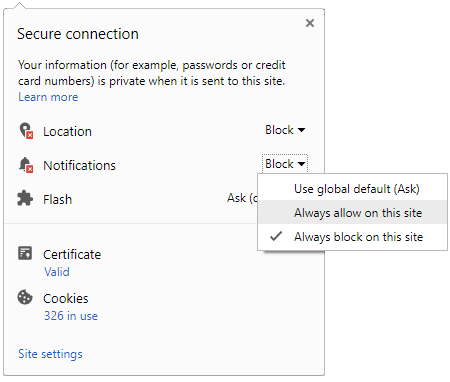
 Click it and Unblock the Notifications
SBI Contra Fund - Direct Plan
3 Year Absolute Returns
37.11% ↑
NAV (₹) on 16 Nov 2026
422.50
1 Day NAV Change
0.05%
Risk Level
Very High Risk
Rating
-
SBI Contra Fund - Direct Plan is a Equity mutual fund categorized under Diversified, offered by SBI Funds Management Ltd.. Launched on 01 Jan 2013, investors can start with a minimum SIP of ₹100 or a ... Read more
NAV History
Fund Details
Returns Calculator
Asset Allocation
AUM
₹ 44,443.13 Cr
Sector Holdings
| Sectors | Weightage |
|---|---|
| Finance - Banks - Private Sector | 14.78% |
| Treps/Reverse Repo | 9.49% |
| Pharmaceuticals | 6.90% |
| IT Consulting & Software | 6.15% |
| Refineries | 5.70% |
| Power - Generation/Distribution | 5.00% |
| Finance - Banks - Public Sector | 3.60% |
| Iron & Steel | 2.79% |
| Telecom Equipment | 2.73% |
| Cement | 2.66% |
| E-Commerce/E-Retail | 2.45% |
| Gas Transmission/Marketing | 2.32% |
| Auto - LCVs/HCVs | 2.09% |
| Cigarettes & Tobacco Products | 1.85% |
| Auto - 2 & 3 Wheelers | 1.82% |
| Non-Banking Financial Company (NBFC) | 1.59% |
| Personal Care | 1.55% |
| Finance - Life Insurance | 1.54% |
| Telecom Services | 1.43% |
| Port & Port Services | 1.42% |
| Hospitals & Medical Services | 1.41% |
| Agro Chemicals/Pesticides | 1.39% |
| Foreign Securities | 1.37% |
| Treasury Bill | 1.32% |
| Logistics - Warehousing/Supply Chain/Others | 1.31% |
| Abrasives And Grinding Wheels | 1.30% |
| Oil Drilling And Exploration | 1.21% |
| Aluminium | 1.12% |
| Chemicals - Speciality | 1.05% |
| Auto - Cars & Jeeps | 1.01% |
| Real Estate Investment Trusts (REIT) | 0.98% |
| Others - Not Mentioned | 0.96% |
| Beverages & Distilleries | 0.94% |
| Construction, Contracting & Engineering | 0.88% |
| Consumer Electronics | 0.74% |
| Auto Ancl - Electrical | 0.70% |
| LPG/CNG/PNG/LNG Bottling/Distribution | 0.62% |
| Realty | 0.55% |
| Textiles - Spinning - Cotton Blended | 0.47% |
| Mining/Minerals | 0.43% |
| Finance - Mutual Funds | 0.34% |
| Infrastructure - General | 0.31% |
| Engineering - Heavy | 0.29% |
| Diversified | 0.27% |
| Exchange Platform | 0.25% |
| Bearings | 0.23% |
| Compressors | 0.21% |
| Domestic Appliances | 0.17% |
| Plywood/Laminates | 0.09% |
| Cables - Power/Others | 0.08% |
| Auto Ancl - Dr. Trans & Steer - Others | 0.07% |
| Derivatives | 0.05% |
| Net Receivables/(Payables) | 0.02% |
Stock Holdings
| Name | Weightage | Value (in Cr.) | Sector |
|---|---|---|---|
| TREPS | 9.49% | ₹ 4,218.44 | Others |
| HDFC Bank Ltd. | 5.36% | ₹ 2,383.18 | Finance - Banks - Private Sector |
| ICICI Bank Ltd. | 4.68% | ₹ 2,080.44 | Finance - Banks - Private Sector |
| Reliance Industries Ltd. | 4.64% | ₹ 2,063.92 | Refineries |
| Biocon Ltd. | 3.17% | ₹ 1,409.80 | Pharmaceuticals |
| Indus Towers Ltd. | 2.73% | ₹ 1,215.35 | Telecom Equipment |
| Torrent Power Ltd. | 2.37% | ₹ 1,053.55 | Power - Generation/Distribution |
| GAIL (India) Ltd. | 2.32% | ₹ 1,032.88 | Gas Transmission/Marketing |
| Tata Steel Ltd. | 1.96% | ₹ 872.65 | Iron & Steel |
| Punjab National Bank | 1.88% | ₹ 837.28 | Finance - Banks - Public Sector |
| Infosys Ltd. | 1.86% | ₹ 825.63 | IT Consulting & Software |
| ITC Ltd. | 1.85% | ₹ 823.75 | Cigarettes & Tobacco Products |
| FSN E-Commerce Ventures Ltd. | 1.74% | ₹ 775.17 | E-Commerce/E-Retail |
| Kotak Mahindra Bank Ltd. | 1.72% | ₹ 762.69 | Finance - Banks - Private Sector |
| State Bank of India | 1.62% | ₹ 721.44 | Finance - Banks - Public Sector |
| Mahindra & Mahindra Financial Services Ltd. | 1.59% | ₹ 706.78 | Non-Banking Financial Company (NBFC) |
| Dabur India Ltd. | 1.55% | ₹ 689.03 | Personal Care |
| Cognizant Technology Solutions Corporation | 1.51% | ₹ 669.43 | IT Consulting & Software |
| Tech Mahindra Ltd. | 1.49% | ₹ 663.94 | IT Consulting & Software |
| JSW Infrastructure Ltd. | 1.42% | ₹ 632.20 | Port & Port Services |
| Aster DM Quality Care Ltd. | 1.41% | ₹ 626.63 | Hospitals & Medical Services |
| Bharti Airtel Ltd. | 1.40% | ₹ 622.12 | Telecom Services |
| Epam Systems Inc | 1.37% | ₹ 608.50 | Others |
| Axis Bank Ltd. | 1.34% | ₹ 596.85 | Finance - Banks - Private Sector |
| Bajaj Auto Ltd. | 1.30% | ₹ 577.10 | Auto - 2 & 3 Wheelers |
| Bandhan Bank Ltd. | 1.28% | ₹ 568.59 | Finance - Banks - Private Sector |
| Oil & Natural Gas Corporation Ltd. | 1.21% | ₹ 538.61 | Oil Drilling And Exploration |
| Delhivery Ltd. | 1.21% | ₹ 535.95 | Logistics - Warehousing/Supply Chain/Others |
| Cipla Ltd. | 1.19% | ₹ 529.08 | Pharmaceuticals |
| NHPC Ltd. | 1.17% | ₹ 520.86 | Power - Generation/Distribution |
| Hindalco Industries Ltd. | 1.12% | ₹ 498.97 | Aluminium |
| Tata Motors Ltd. | 1.11% | ₹ 491.25 | Auto - LCVs/HCVs |
| Indian Oil Corporation Ltd. | 1.06% | ₹ 469.19 | Refineries |
| UPL Ltd. | 1.01% | ₹ 449.44 | Agro Chemicals/Pesticides |
| Maruti Suzuki India Ltd. | 1.01% | ₹ 448.43 | Auto - Cars & Jeeps |
| ICICI Life Insurance Ltd. | 1.01% | ₹ 448.38 | Finance - Life Insurance |
| Tata Motors Passenger Vehicles Ltd. | 0.98% | ₹ 435.11 | Auto - LCVs/HCVs |
| Embassy Office Parks Reit | 0.98% | ₹ 435.65 | Real Estate Investment Trusts (REIT) |
| 364 DAY T-BILL 06.11.26 | 0.96% | ₹ 424.67 | Others - Not Mentioned |
| United Spirits Ltd. | 0.88% | ₹ 391.72 | Beverages & Distilleries |
| Larsen & Toubro Ltd. | 0.88% | ₹ 389.11 | Construction, Contracting & Engineering |
| JSW Energy Ltd. | 0.85% | ₹ 376.45 | Power - Generation/Distribution |
| JSW Steel Ltd. | 0.81% | ₹ 361.34 | Iron & Steel |
| Gland Pharma Ltd. | 0.78% | ₹ 344.58 | Pharmaceuticals |
| Grasim Industries Ltd. | 0.75% | ₹ 332.60 | Cement |
| Mankind Pharma Ltd. | 0.74% | ₹ 331.05 | Pharmaceuticals |
| Whirlpool of India Ltd. | 0.74% | ₹ 329.06 | Consumer Electronics |
| Swiggy Ltd. | 0.71% | ₹ 317.67 | E-Commerce/E-Retail |
| Samvardhana Motherson International Ltd. | 0.70% | ₹ 309.81 | Auto Ancl - Electrical |
| Wipro Ltd. | 0.67% | ₹ 297.46 | IT Consulting & Software |
| 91 DAY T-BILL 19.11.26 | 0.67% | ₹ 299.18 | Others |
| Grindwell Norton Ltd. | 0.63% | ₹ 281.16 | Abrasives And Grinding Wheels |
| Petronet LNG Ltd. | 0.62% | ₹ 274.57 | LPG/CNG/PNG/LNG Bottling/Distribution |
| CESC Ltd. | 0.61% | ₹ 272.36 | Power - Generation/Distribution |
| Neogen Chemicals Ltd. | 0.61% | ₹ 271.05 | Chemicals - Speciality |
| Prism Johnson Ltd. | 0.60% | ₹ 265.68 | Cement |
| Nuvoco Vistas Corporation Ltd. | 0.60% | ₹ 268.19 | Cement |
| Ashiana Housing Ltd. | 0.55% | ₹ 242.24 | Realty |
| Life Insurance Corporation of India | 0.53% | ₹ 237.71 | Finance - Life Insurance |
| Hero MotoCorp Ltd. | 0.52% | ₹ 231.88 | Auto - 2 & 3 Wheelers |
| K.P.R. Mill Ltd. | 0.47% | ₹ 210.23 | Textiles - Spinning - Cotton Blended |
| 91 DAY T-BILL 31.12.26 | 0.45% | ₹ 198.16 | Others |
| Lupin Ltd. | 0.45% | ₹ 200.09 | Pharmaceuticals |
| Apar Industries Ltd. | 0.44% | ₹ 196.20 | Chemicals - Speciality |
| NMDC Ltd. | 0.43% | ₹ 192.18 | Mining/Minerals |
| Carborundum Universal Ltd. | 0.42% | ₹ 186.87 | Abrasives And Grinding Wheels |
| Equitas Small Finance Bank Ltd. | 0.40% | ₹ 177.39 | Finance - Banks - Private Sector |
| Rallis India Ltd. | 0.38% | ₹ 168.34 | Agro Chemicals/Pesticides |
| Tata Consultancy Services Ltd. | 0.37% | ₹ 163.35 | IT Consulting & Software |
| ACC Ltd. | 0.37% | ₹ 163.08 | Cement |
| The Ramco Cements Ltd. | 0.34% | ₹ 151.62 | Cement |
| HDFC Asset Management Co. Ltd. | 0.34% | ₹ 149.78 | Finance - Mutual Funds |
| G R Infra projects Ltd. | 0.31% | ₹ 136.31 | Infrastructure - General |
| Disa India Ltd. | 0.29% | ₹ 128.49 | Engineering - Heavy |
| E.I.D-Parry (India) Ltd. | 0.27% | ₹ 121.20 | Diversified |
| Syngene International Ltd. | 0.26% | ₹ 114.86 | Pharmaceuticals |
| Indian Energy Exchange Ltd. | 0.25% | ₹ 112.74 | Exchange Platform |
| WENDT (India) Ltd. | 0.25% | ₹ 112.48 | Abrasives And Grinding Wheels |
| HCL Technologies Ltd. | 0.25% | ₹ 109.41 | IT Consulting & Software |
| Timken India Ltd. | 0.23% | ₹ 103.34 | Bearings |
| Ingersoll Rand (India) Ltd. | 0.21% | ₹ 92.47 | Compressors |
| Sanofi India Ltd. | 0.18% | ₹ 80.61 | Pharmaceuticals |
| 182 DAY T-BILL 05.11.26 | 0.17% | ₹ 74.95 | Others |
| V-Guard Industries Ltd. | 0.17% | ₹ 75.84 | Domestic Appliances |
| Aurobindo Pharma Ltd. | 0.13% | ₹ 59.19 | Pharmaceuticals |
| Bank of India | 0.10% | ₹ 43.66 | Finance - Banks - Public Sector |
| Gateway Distriparks Ltd. | 0.10% | ₹ 42.59 | Logistics - Warehousing/Supply Chain/Others |
| Greenply Industries Ltd. | 0.09% | ₹ 38.17 | Plywood/Laminates |
| Motherson Sumi Wiring India Ltd. | 0.08% | ₹ 37.20 | Cables - Power/Others |
| Automotive Axles Ltd. | 0.07% | ₹ 30.80 | Auto Ancl - Dr. Trans & Steer - Others |
| Sula Vineyards Ltd. | 0.06% | ₹ 25.59 | Beverages & Distilleries |
| Margin amount for Derivative positions | 0.05% | ₹ 20.14 | Others |
| 364 DAY T-BILL 19.11.26 | 0.03% | ₹ 14.96 | Others |
| Jio Platforms Ltd. | 0.03% | ₹ 12.96 | Telecom Services |
| Net Receivable / Payable | 0.02% | ₹ 0.31 | Others |
| NMDC Steel Ltd. | 0.02% | ₹ 9.82 | Iron & Steel |
Returns
| Annualised returns | ||||
|---|---|---|---|---|
| 9M | 1Y | 2Y | 3Y | |
| Fund returns | -1.78% | -2.17% | 2.38% | 11.09% |
| Category returns | 5.30% | 3.66% | 10.30% | 36.93% |
Fund Objective
To provide the investors maximum growth opportunity through equity investments in stocks of growth oriented sectors of the economy. There are five sub-funds dedicated to specific investment themes ... Read more
AMC Details
Top Funds from Equity - Contra
|
Scheme Name
|
NAV
|
Returns
1Y
3Y
5Y
|
AUM (Cr)
|
Expense Ratio
|
Risk Meter
|
||
|---|---|---|---|---|---|---|---|
|
Invesco India Contra Fund - Direct Plan
Diversified
Direct
|
₹165.43 | 2.07% | 53.22% | 83.75% | ₹19,228 | 0.78% |
Very High
|
|
Kotak Contra Fund - Direct Plan
Diversified
Direct
|
₹66.08 | 1.37% | 50.94% | 93.71% | ₹5,074 | 0.80% |
Very High
|
|
Kotak Contra Fund - Direct Plan
Diversified
Direct
|
₹66.08 | 1.37% | 50.94% | 93.71% | ₹5,074 | 0.80% |
Very High
|
|
Kotak Contra Fund - Direct Plan
Diversified
Direct
|
₹185.68 | 1.37% | 50.93% | 93.71% | ₹5,074 | 0.80% |
Very High
|
|
Invesco India Contra Fund
Diversified
Regular
|
₹139.10 | 0.94% | 48.18% | 73.48% | ₹19,228 | 1.87% |
Very High
|
|
Kotak Contra Fund - Regular Plan
Diversified
Regular
|
₹154.84 | 0.11% | 45.21% | 81.29% | ₹5,074 | 2.03% |
Very High
|
|
Kotak Contra Fund - Regular Plan
Diversified
Regular
|
₹53.37 | 0.11% | 45.21% | 81.29% | ₹5,074 | 2.03% |
Very High
|
|
Kotak Contra Fund - Regular Plan
Diversified
Regular
|
₹53.37 | 0.11% | 45.21% | 81.29% | ₹5,074 | 2.03% |
Very High
|
|
SBI Contra Fund - Direct Plan
Diversified
Direct
|
₹89.17 | -2.17% | 37.11% | 93.84% | ₹44,443 | 0.88% |
Very High
|
|
SBI Contra Fund - Direct Plan
Diversified
Direct
|
₹89.17 | -2.17% | 37.11% | 93.84% | ₹44,443 | 0.88% |
Very High
|
Top Funds from SBI Funds Management Ltd.
|
Scheme Name
|
NAV
|
Returns
1Y
3Y
5Y
|
AUM (Cr)
|
Expense Ratio
|
Risk Meter
|
||
|---|---|---|---|---|---|---|---|
|
SBI Gold ETF
ETF
Regular
|
₹113.93 | 6.82% | 114.84% | 157.83% | ₹25,710 | 0.65% |
High
|
|
SBI Gold Fund - Direct Plan
Fund of Funds
Direct
|
₹40.58 | 5.98% | 113.92% | 157.87% | ₹16,744 | 0.25% |
Very High
|
|
SBI Gold Fund - Direct Plan
Fund of Funds
Direct
|
₹40.52 | 5.98% | 113.92% | 157.86% | ₹16,744 | 0.25% |
Very High
|
|
SBI Gold Fund - Direct Plan
Fund of Funds
Direct
|
₹40.52 | 5.98% | 113.92% | 157.86% | ₹16,744 | 0.25% |
Very High
|
|
SBI Gold Fund
Fund of Funds
Regular
|
₹38.69 | 5.81% | 112.74% | 154.87% | ₹16,744 | 0.42% |
Very High
|
|
SBI Gold Fund
Fund of Funds
Regular
|
₹38.69 | 5.80% | 112.72% | 154.85% | ₹16,744 | 0.42% |
Very High
|
|
SBI Gold Fund
Fund of Funds
Regular
|
₹38.69 | 5.80% | 112.72% | 154.85% | ₹16,744 | 0.42% |
Very High
|
|
SBI Healthcare Opportunities Fund - Direct Plan
Sector
Direct
|
₹623.72 | 25.09% | 94.74% | 151.51% | ₹6,067 | 1.01% |
Very High
|
|
SBI Healthcare Opportunities Fund - Direct Plan
Sector
Direct
|
₹433.34 | 25.09% | 94.74% | 151.51% | ₹6,067 | 1.01% |
Very High
|
|
SBI Healthcare Opportunities Fund - Direct Plan
Sector
Direct
|
₹433.34 | 25.09% | 94.74% | 151.51% | ₹6,067 | 1.01% |
Very High
|
FAQs
What is the current NAV of SBI Contra Fund - Direct Plan Growth?
What is the fund size (AUM) of SBI Contra Fund - Direct Plan Growth?
What are the historical returns of SBI Contra Fund - Direct Plan Growth?
What is the risk level of SBI Contra Fund - Direct Plan Growth?
What is the minimum investment amount for SBI Contra Fund - Direct Plan Growth?
Disclaimer: This is 3rd Party content/feed, viewers are requested to use their discretion and conduct proper diligence before investing, GoodReturns does not take any liability on the genuineness and correctness of the information in this article
-
Block for 8 hours
-
Block for 12 hours
-
Block for 24 hours
-
Don't block

 Sign in with Google
- Male
- Female
- Others
- Under 18
- 18 to 25
- 26 to 35
- 36 to 45
- 45 to 55
- 55+