
 A Oneindia Venture


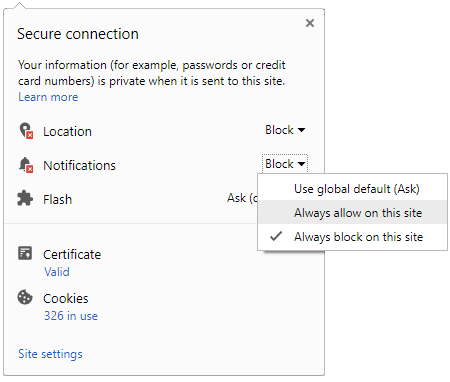
 Click it and Unblock the Notifications
LIC MF Nifty 50 Index Fund - Direct Plan
3 Year Absolute Returns
30.76% ↑
NAV (₹) on 16 Nov 2026
151.61
1 Day NAV Change
0.58%
Risk Level
Very High Risk
Rating
-
LIC MF Nifty 50 Index Fund - Direct Plan is a Equity mutual fund categorized under Index, offered by LIC Mutual Fund Asset Management Limited. Launched on 01 Jan 2013, investors can start with a ... Read more
NAV History
Fund Details
Returns Calculator
Asset Allocation
AUM
₹ 352.47 Cr
Sector Holdings
| Sectors | Weightage |
|---|---|
| Finance - Banks - Private Sector | 25.81% |
| IT Consulting & Software | 8.79% |
| Refineries | 7.30% |
| Telecom Services | 5.62% |
| Construction, Contracting & Engineering | 4.24% |
| Auto - Cars & Jeeps | 3.77% |
| Finance - Banks - Public Sector | 3.72% |
| Non-Banking Financial Company (NBFC) | 3.48% |
| Pharmaceuticals | 3.26% |
| Iron & Steel | 2.43% |
| Cigarettes & Tobacco Products | 2.40% |
| E-Commerce/E-Retail | 2.33% |
| Cement | 2.27% |
| Auto - 2 & 3 Wheelers | 1.99% |
| Gems, Jewellery & Precious Metals | 1.72% |
| Personal Care | 1.55% |
| Hospitals & Medical Services | 1.41% |
| Power - Generation/Distribution | 1.41% |
| Port & Port Services | 1.36% |
| Exchange Platform | 1.35% |
| Aerospace & Defense | 1.24% |
| Finance - Life Insurance | 1.22% |
| Aluminium | 1.20% |
| Power - Transmission/Equipment | 1.12% |
| Airlines | 1.04% |
| Paints/Varnishes | 0.98% |
| Retail - Apparel/Accessories | 0.94% |
| Holding Company | 0.91% |
| Mining/Minerals | 0.88% |
| Trading & Distributors | 0.83% |
| Oil Drilling And Exploration | 0.82% |
| Food Processing & Packaging | 0.78% |
| Investment Company | 0.63% |
| Tea & Coffee | 0.62% |
| Auto - LCVs/HCVs | 0.52% |
| Treps/Reverse Repo | 0.19% |
Stock Holdings
| Name | Weightage | Value (in Cr.) | Sector |
|---|---|---|---|
| HDFC Bank Ltd. | 9.95% | ₹ 35.07 | Finance - Banks - Private Sector |
| ICICI Bank Ltd. | 9.40% | ₹ 33.14 | Finance - Banks - Private Sector |
| Reliance Industries Ltd. | 7.30% | ₹ 25.72 | Refineries |
| Bharti Airtel Ltd. | 5.62% | ₹ 19.83 | Telecom Services |
| Larsen & Toubro Ltd. | 4.24% | ₹ 14.96 | Construction, Contracting & Engineering |
| Infosys Ltd. | 3.92% | ₹ 13.83 | IT Consulting & Software |
| State Bank of India | 3.72% | ₹ 13.13 | Finance - Banks - Public Sector |
| Axis Bank Ltd. | 3.28% | ₹ 11.55 | Finance - Banks - Private Sector |
| Kotak Mahindra Bank Ltd. | 3.18% | ₹ 11.22 | Finance - Banks - Private Sector |
| Bajaj Finance Ltd. | 2.40% | ₹ 8.47 | Non-Banking Financial Company (NBFC) |
| ITC Ltd. | 2.40% | ₹ 8.44 | Cigarettes & Tobacco Products |
| Tata Consultancy Services Ltd. | 2.39% | ₹ 8.42 | IT Consulting & Software |
| Mahindra & Mahindra Ltd. | 2.38% | ₹ 8.39 | Auto - Cars & Jeeps |
| Eternal Ltd. | 2.33% | ₹ 8.20 | E-Commerce/E-Retail |
| Sun Pharmaceutical Industries Ltd. | 1.76% | ₹ 6.22 | Pharmaceuticals |
| Titan Company Ltd. | 1.72% | ₹ 6.05 | Gems, Jewellery & Precious Metals |
| Hindustan Unilever Ltd. | 1.55% | ₹ 5.47 | Personal Care |
| NTPC Ltd. | 1.41% | ₹ 4.97 | Power - Generation/Distribution |
| HCL Technologies Ltd. | 1.41% | ₹ 4.96 | IT Consulting & Software |
| Maruti Suzuki India Ltd. | 1.39% | ₹ 4.89 | Auto - Cars & Jeeps |
| Adani Ports & Special Economic Zone Ltd. | 1.36% | ₹ 4.78 | Port & Port Services |
| BSE Ltd. | 1.35% | ₹ 4.74 | Exchange Platform |
| Tata Steel Ltd. | 1.31% | ₹ 4.60 | Iron & Steel |
| Bharat Electronics Ltd. | 1.24% | ₹ 4.36 | Aerospace & Defense |
| Ultratech Cement Ltd. | 1.22% | ₹ 4.30 | Cement |
| Hindalco Industries Ltd. | 1.20% | ₹ 4.23 | Aluminium |
| JSW Steel Ltd. | 1.12% | ₹ 3.95 | Iron & Steel |
| Power Grid Corporation of India Ltd. | 1.12% | ₹ 3.94 | Power - Transmission/Equipment |
| Shriram Finance Ltd. | 1.08% | ₹ 3.79 | Non-Banking Financial Company (NBFC) |
| Tech Mahindra Ltd. | 1.07% | ₹ 3.76 | IT Consulting & Software |
| Bajaj Auto Ltd. | 1.06% | ₹ 3.73 | Auto - 2 & 3 Wheelers |
| Grasim Industries Ltd. | 1.05% | ₹ 3.71 | Cement |
| InterGlobe Aviation Ltd. | 1.04% | ₹ 3.66 | Airlines |
| Asian Paints Ltd. | 0.98% | ₹ 3.45 | Paints/Varnishes |
| Trent Ltd. | 0.94% | ₹ 3.31 | Retail - Apparel/Accessories |
| Eicher Motors Ltd. | 0.93% | ₹ 3.29 | Auto - 2 & 3 Wheelers |
| Bajaj Finserv Ltd. | 0.91% | ₹ 3.20 | Holding Company |
| Coal India Ltd. | 0.88% | ₹ 3.09 | Mining/Minerals |
| Adani Enterprises Ltd. | 0.83% | ₹ 2.91 | Trading & Distributors |
| Oil & Natural Gas Corporation Ltd. | 0.82% | ₹ 2.88 | Oil Drilling And Exploration |
| Apollo Hospitals Enterprise Ltd. | 0.81% | ₹ 2.86 | Hospitals & Medical Services |
| Nestle India Ltd. | 0.78% | ₹ 2.74 | Food Processing & Packaging |
| Dr. Reddy's Laboratories Ltd. | 0.78% | ₹ 2.73 | Pharmaceuticals |
| Cipla Ltd. | 0.72% | ₹ 2.55 | Pharmaceuticals |
| SBI Life Insurance Company Ltd. | 0.69% | ₹ 2.45 | Finance - Life Insurance |
| Jio Financial Services Ltd. | 0.63% | ₹ 2.21 | Investment Company |
| Tata Consumer Products Ltd. | 0.62% | ₹ 2.20 | Tea & Coffee |
| Max Healthcare Institute Ltd. | 0.60% | ₹ 2.10 | Hospitals & Medical Services |
| HDFC Life Insurance Company Ltd. | 0.53% | ₹ 1.86 | Finance - Life Insurance |
| Tata Motors Passenger Vehicles Ltd. | 0.52% | ₹ 1.83 | Auto - LCVs/HCVs |
| Treps | 0.19% | ₹ 0.68 | Others |
Returns
| Annualised returns | ||||
|---|---|---|---|---|
| 9M | 1Y | 2Y | 3Y | |
| Fund returns | -1.00% | -1.95% | 4.36% | 9.35% |
| Category returns | 1.20% | 0.81% | 7.13% | 17.31% |
Fund Objective
An open ended Index linked equity scheme seeking to provide capital growth by investing in index stocks.
AMC Details
Top Funds from Others - Index Funds/ETFs
|
Scheme Name
|
NAV
|
Returns
1Y
3Y
5Y
|
AUM (Cr)
|
Expense Ratio
|
Risk Meter
|
||
|---|---|---|---|---|---|---|---|
|
UTI Silver Exchange Traded Fund
ETF
Regular
|
₹163.35 | 6.49% | 129.57% | 0.00% | ₹1,286 | 0.59% |
Very High
|
|
Mirae Asset NYSE FANG + ETF
ETF
Regular
|
₹154.97 | 8.64% | 129.21% | 161.53% | ₹4,059 | 0.66% |
Very High
|
|
Aditya Birla Sun Life Silver ETF
ETF
Regular
|
₹168.85 | 5.82% | 126.73% | 0.00% | ₹2,385 | 0.35% |
Very High
|
|
Kotak Silver ETF
ETF
Regular
|
₹16.41 | 5.76% | 126.38% | 0.00% | ₹3,120 | 0.35% |
Very High
|
|
ICICI Prudential Silver ETF
ETF
Regular
|
₹168.60 | 5.69% | 125.63% | 0.00% | ₹11,932 | 0.40% |
Very High
|
|
Mirae Asset Silver ETF
ETF
Regular
|
₹165.01 | 5.84% | 125.43% | 0.00% | ₹1,016 | 0.35% |
Very High
|
|
DSP Silver ETF
ETF
Regular
|
₹16.24 | 5.31% | 125.17% | 0.00% | ₹1,140 | N/A |
Very High
|
|
Nippon India Silver ETF
ETF
Regular
|
₹161.70 | 5.56% | 124.07% | 0.00% | ₹26,991 | N/A |
Very High
|
|
HDFC Silver ETF
ETF
Regular
|
₹161.78 | 5.37% | 123.83% | 0.00% | ₹6,755 | 0.50% |
Very High
|
|
Axis Silver ETF
ETF
Regular
|
₹168.51 | 5.91% | 123.39% | 0.00% | ₹1,742 | 0.42% |
Very High
|
Top Funds from LIC Mutual Fund Asset Management Limited
|
Scheme Name
|
NAV
|
Returns
1Y
3Y
5Y
|
AUM (Cr)
|
Expense Ratio
|
Risk Meter
|
||
|---|---|---|---|---|---|---|---|
|
LIC MF Gold ETF
ETF
Regular
|
₹120.48 | 6.43% | 117.26% | 163.19% | ₹1,378 | 0.45% |
High
|
|
LIC MF Gold ETF FOF - Direct Plan
Fund of Funds
Direct
|
₹36.29 | 5.45% | 113.38% | 159.77% | ₹797 | 0.35% |
High
|
|
LIC MF Gold ETF FOF
Fund of Funds
Regular
|
₹34.28 | 5.16% | 111.03% | 154.82% | ₹797 | 0.61% |
High
|
|
LIC MF Healthcare Fund - Direct Plan
Sector
Direct
|
₹38.84 | 17.78% | 81.36% | 96.44% | ₹97 | 1.37% |
Very High
|
|
LIC MF Healthcare Fund - Direct Plan
Sector
Direct
|
₹38.82 | 17.78% | 81.31% | 96.37% | ₹97 | 1.37% |
Very High
|
|
LIC MF Healthcare Fund - Direct Plan
Sector
Direct
|
₹38.82 | 17.78% | 81.31% | 96.37% | ₹97 | 1.37% |
Very High
|
|
LIC MF Infrastructure Fund - Direct Plan
Sector
Direct
|
₹62.84 | 9.27% | 79.66% | 151.39% | ₹1,100 | 1.33% |
Very High
|
|
LIC MF Infrastructure Fund - Direct Plan
Sector
Direct
|
₹61.70 | 9.27% | 79.57% | 150.38% | ₹1,100 | 1.33% |
Very High
|
|
LIC MF Infrastructure Fund - Direct Plan
Sector
Direct
|
₹61.70 | 9.27% | 79.57% | 150.38% | ₹1,100 | 1.33% |
Very High
|
|
LIC MF Healthcare Fund
Sector
Regular
|
₹34.97 | 16.22% | 74.61% | 84.62% | ₹97 | 2.67% |
Very High
|
FAQs
What is the current NAV of LIC MF Nifty 50 Index Fund - Direct Plan Growth?
What is the fund size (AUM) of LIC MF Nifty 50 Index Fund - Direct Plan Growth?
What are the historical returns of LIC MF Nifty 50 Index Fund - Direct Plan Growth?
What is the risk level of LIC MF Nifty 50 Index Fund - Direct Plan Growth?
What is the minimum investment amount for LIC MF Nifty 50 Index Fund - Direct Plan Growth?
Disclaimer: This is 3rd Party content/feed, viewers are requested to use their discretion and conduct proper diligence before investing, GoodReturns does not take any liability on the genuineness and correctness of the information in this article
-
Block for 8 hours
-
Block for 12 hours
-
Block for 24 hours
-
Don't block

 Sign in with Google
- Male
- Female
- Others
- Under 18
- 18 to 25
- 26 to 35
- 36 to 45
- 45 to 55
- 55+